Research / Original analysis
Will your lake be open on the fishing opener? Ice-out and opener dates, 1999 to 2026
Joining DNR ice-out reports for 65 lakes with each year's opener date: ice-out came after the opener in 31 of 1,492 lake-years, all in four springs, all on lakes at 45.5 degrees north or above, and all with a May 10 or 11 opener.
Byline pending. Analysis run on public Minnesota DNR records and statute text; awaiting a named contributor and human review. Data collected . Compiled .
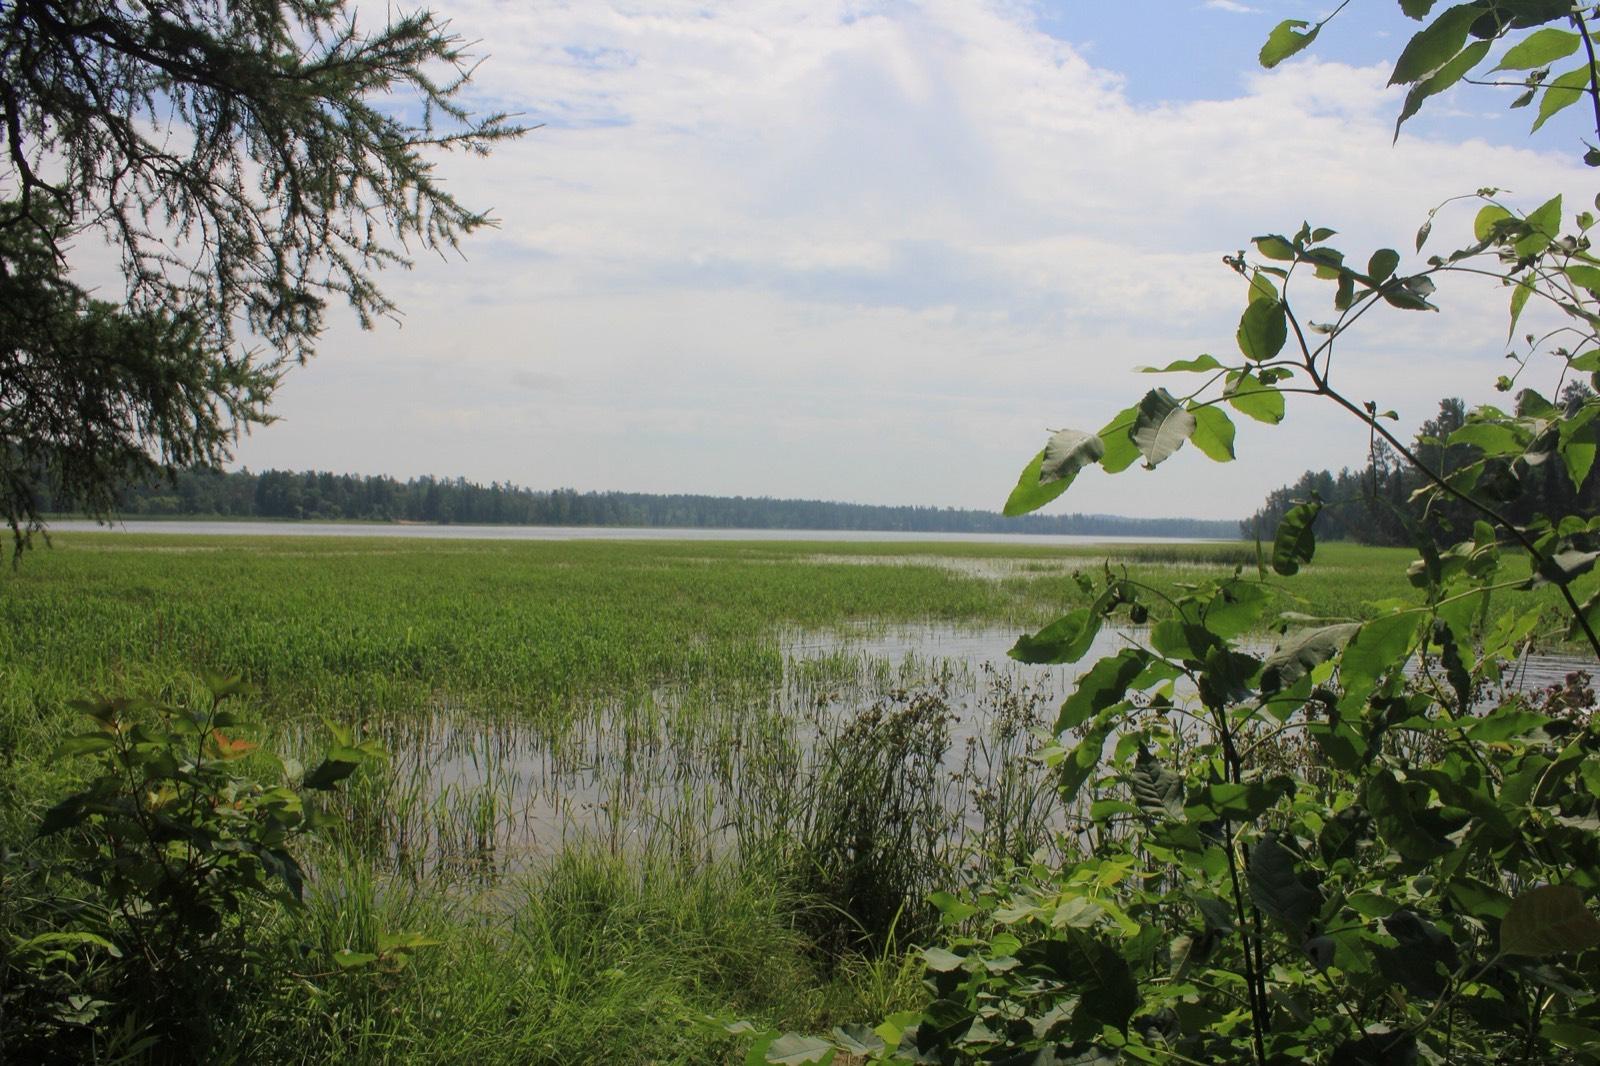
Lake Itasca from the Mississippi Headwaters, July 2017.
Photo: Sheltoneasley, CC BY-SA 4.0. Not taken by MNIRL; resized. Credits
Quick read
- Ice-out after the opener
- 31 of 1,492 lake-years (2.1%), in 2008, 2013, 2014 and 2025
- Typical lake
- Ice out 30 days before the opener; in the worst tenth of lake-years, 9 days or fewer
- By latitude
- None of 33 lakes south of 45.5 N; 5.2% of lake-years north of 46.5 N
- By opener date
- Ice at the opener in 4 of 12 springs with a May 9 to 11 opener, 0 of 16 with May 12 to 15
The short answer
Mostly yes, and the exceptions are few and northern. Across 65 Minnesota lakes with long DNR ice-out records, the ice was reported out before the fishing opener in 97.9% of the 1,492 lake-years from 1999 to 2026. In the typical lake-year the ice had been out for 30 days by opener morning.
The other 31 lake-years came from just 4 springs: 2008, 2013, 2014 and 2025. Nearly two-thirds of them were in 2013, when 20 of the 53 lakes reporting still had ice at the opener. None was south of 45.5 degrees north, a line just south of St. Cloud.
This describes 28 past springs on 65 lakes. It is not a forecast for this year, and a lake being "open" in the record does not mean its ramp, shoreline or bays are clear.
What this means for your opener plans
- South of 45.5 N, the record gives little to worry about. The 33 lakes below that line never had ice-out reported after the opener in 722 lake-years. The closest call was 3 days of open water (44.5 to 45.5 N).
- North of 46.5 N, keep a second plan. Ice-out came after the opener in 5.2% of lake-years, and fell within a week of it in 15%. Rainy Lake had ice at the opener in 4 of its 28 reported years; Vermilion in 3 of 28. In between (45.5 to 46.5 N, which includes Mille Lacs and many central lakes) the rate was 2.3%.
- The opener moves, and the early dates carry the risk. The opener is a Saturday between May 9 and May 15. In the 16 years with an opener on May 12 or later, no lake in the study had ice-out reported after it. All 4 springs with ice at the opener had an opener on May 10 or 11. The DNR lists the next openers as May 15, 2027; May 13, 2028; May 12, 2029; May 11, 2030. May 15, 2027 is the latest date the opener can fall on. That says nothing about 2027's weather.
- Treat opener weekend as a range. If you hold a cabin or guide for a northern lake, ask about cancellation terms, and call the resort or the DNR area office the week before about the ramp and shoreline.
- A late-ice year looks like 2013. The opener was May 11. The typical reporting lake had been ice-free for 3 days, 20 lakes still had ice, and 32 of 53 were within a week or worse. DNR and news reports at the time described large northern lakes, and Mille Lacs, still covered.
Look up your lake
Pick a lake and a date the opener could fall on. The tool counts, in that lake's own years, how often ice-out was reported after that date.
Years in parentheses are upcoming openers listed in the DNR season table. Counts use 1999 to 2026. Lakes with fewer than 20 years of reports in that span are left out.
46.24 degrees north · 28 years of reports
Mille Lacs
Ice was reported out after May 15 in 1 of 28 years, and less than a week before it or later in 2 of 28.
The wait would have run past May 15 in 1 year. Counted against the same calendar date every year. The actual opener moves between May 9 and May 15.
Past years, not a forecast. A reported ice-out date does not mean the ramp is clear, the shore is open or the ice is safe. Confirm the opener date and any special rules for the lake with the DNR.
Four findings
- Trouble at the opener is rare and bunched in a few years. 31 lake-years (2.1%) had ice-out after the opener, and 89 (6%) had ice-out on the opener or less than a week before it. Those 89 fall in 9 of 28 years.
- Latitude is the strongest pattern. The share of lake-years at or near the opener runs 0%, 0.8%, 5.1% and 15% from the southern to the northern band. Of 65 lakes, 31 never came within a week of the opener.
- Which May Saturday it is seems to matter. Openers on May 9 to 11 (12 years) had 4 springs with ice at the opener; openers on May 12 to 15 (16 years) had none. A one-sided exact test on those counts gives p = 0.024. We chose the May 11 cut after looking at the results, and with only four such springs this is a pattern to note, not a proof. One of the four, 2025, is a single lake: Rainy, with ice-out reported one day after the opener. Weather, not the date, melts the ice: a cold spring costs more when the opener comes a few days sooner.
- The recent half has more close calls, mostly from one spring. Ice-out came after the opener in 0.5% of lake-years in 1999 to 2012 and 3.9% in 2013 to 2026. Without 2013 the later figure is 1.1%. Within a week or worse: 2.1% against 10.4% (6.3% without 2013). Fourteen springs per era is too few to call this a trend. The 1999 to 2012 and 2013 to 2026 openers also fell on similar dates (average May 12.5 and 11.5).
Lakes with ice-out at or near the opener, by year (% of lakes reporting)
Bar chart, one bar for each year from 1999 to 2026. Each bar shows the share of reporting lakes where ice was reported out after the opener (dark) or less than a week before it (lighter). Bars are empty in 19 of 28 years. The tallest is 2013, with 32 of 53 lakes (60%) in one of the two groups. The same values are in the table below the chart.
| Year | Opener | Lakes reporting | Ice-out after the opener | On the opener day | Less than 7 days before | Typical lake: days open before opener | Fewest days open, any lake |
|---|---|---|---|---|---|---|---|
| 1999 | May 15 | 63 | 0 | 0 | 0 | 42 | 14 |
| 2000 | May 13 | 60 | 0 | 0 | 0 | 51 | 21 |
| 2001 | May 12 | 61 | 0 | 0 | 0 | 21 | 10 |
| 2002 | May 11 | 63 | 0 | 0 | 0 | 25 | 7 |
| 2003 | May 10 | 61 | 0 | 0 | 1 | 27 | 5 |
| 2004 | May 15 | 61 | 0 | 0 | 0 | 38 | 14 |
| 2005 | May 14 | 62 | 0 | 0 | 0 | 35 | 21 |
| 2006 | May 13 | 58 | 0 | 0 | 0 | 34.5 | 24 |
| 2007 | May 12 | 60 | 0 | 0 | 0 | 36.5 | 8 |
| 2008 | May 10 | 60 | 4 | 1 | 11 | 16 | -4 |
| 2009 | May 9 | 48 | 0 | 0 | 0 | 22.5 | 8 |
| 2010 | May 15 | 48 | 0 | 0 | 0 | 44 | 35 |
| 2011 | May 14 | 47 | 0 | 0 | 0 | 29 | 12 |
| 2012 | May 12 | 50 | 0 | 0 | 0 | 52.5 | 36 |
| 2013 | May 11 | 53 | 20 | 2 | 10 | 3 | -6 |
| 2014 | May 10 | 58 | 6 | 0 | 5 | 15 | -10 |
| 2015 | May 9 | 51 | 0 | 0 | 0 | 30 | 11 |
| 2016 | May 14 | 47 | 0 | 0 | 0 | 53 | 11 |
| 2017 | May 13 | 53 | 0 | 0 | 0 | 44 | 25 |
| 2018 | May 12 | 50 | 0 | 1 | 7 | 10 | 0 |
| 2019 | May 11 | 52 | 0 | 0 | 0 | 20 | 9 |
| 2020 | May 9 | 51 | 0 | 0 | 0 | 31 | 7 |
| 2021 | May 15 | 45 | 0 | 0 | 0 | 46 | 27 |
| 2022 | May 14 | 53 | 0 | 0 | 9 | 21 | 1 |
| 2023 | May 13 | 46 | 0 | 0 | 6 | 16.5 | 2 |
| 2024 | May 11 | 46 | 0 | 0 | 0 | 59 | 20 |
| 2025 | May 10 | 44 | 1 | 0 | 3 | 38.5 | -1 |
| 2026 | May 9 | 41 | 0 | 0 | 2 | 36 | 4 |
Same measure, grouped by the date of the opener (% of lakes)
Dot chart. Columns are the day of May on which the opener fell, from May 9 to May 15; each dot is one year. The height of a dot is the share of reporting lakes with ice-out after, or less than a week before, the opener. May 9: 4 years, 0 with ice-out after the opener; May 10: 4 years, 3 with ice-out after the opener; May 11: 4 years, 1 with ice-out after the opener; May 12: 4 years, 0 with ice-out after the opener; May 13: 4 years, 0 with ice-out after the opener; May 14: 4 years, 0 with ice-out after the opener; May 15: 4 years, 0 with ice-out after the opener. The same grouping is in the table below the chart.
| Opener | Years | Which years | Years with ice-out after the opener | Years with a lake within a week or worse | Typical lake: days open (median of yearly medians) |
|---|---|---|---|---|---|
| May 9 | 4 | 2009, 2015, 2020, 2026 | 0 | 1 | 30.5 |
| May 10 | 4 | 2003, 2008, 2014, 2025 | 3 | 4 | 21.5 |
| May 11 | 4 | 2002, 2013, 2019, 2024 | 1 | 1 | 22.5 |
| May 12 | 4 | 2001, 2007, 2012, 2018 | 0 | 1 | 28.75 |
| May 13 | 4 | 2000, 2006, 2017, 2023 | 0 | 1 | 39.25 |
| May 14 | 4 | 2005, 2011, 2016, 2022 | 0 | 1 | 32 |
| May 15 | 4 | 1999, 2004, 2010, 2021 | 0 | 0 | 43 |
Where the ice stayed past, or nearly past, the opener (1999 to 2026)
Outline map of Minnesota's counties with a dot for each of the 65 lakes. 18 lakes had ice-out reported after the opener in at least one year, 11 more had a year with ice-out less than 7 days before it, 24 had neither, and 12 have too few years to report. Dashed lines mark 45.5 and 46.5 degrees north. Every lake is in the table below the map.
Ice-out at or near the opener, by latitude (% of lake-years)
- 46.5 N and above (19 lakes)15%
- 45.5 to 46.5 N (13 lakes)5.1%
- 44.5 to 45.5 N (23 lakes)0.8%
- Below 44.5 N (10 lakes)0%
Bars by latitude band, showing the share of lake-years with ice-out after the opener and with ice-out less than 7 days before it. 46.5 N and above: 5.2% after, 9.8% within a week, 459 lake-years; 45.5 to 46.5 N: 2.3% after, 2.9% within a week, 311 lake-years; 44.5 to 45.5 N: 0% after, 0.8% within a week, 501 lake-years; Below 44.5 N: 0% after, 0.0% within a week, 221 lake-years. The same values are in the table below the chart.
| Band | Lakes | Lake-years | Ice-out after the opener | On the opener day | Less than 7 days before | Typical days open | Tenth-percentile days open |
|---|---|---|---|---|---|---|---|
| Below 44.5 N | 10 | 221 | 0 (0%) | 0 | 0 | 43 | 26 |
| 44.5 to 45.5 N | 23 | 501 | 0 (0%) | 0 | 4 | 37 | 17 |
| 45.5 to 46.5 N | 13 | 311 | 7 (2.3%) | 1 | 8 | 27 | 11 |
| 46.5 N and above | 19 | 459 | 24 (5.2%) | 3 | 42 | 18 | 3 |
What this can't tell you
- Not a forecast. Past frequency does not predict this spring. March and April weather decide it, and the DNR's ice-out reports for the year are the better check as the opener nears.
- Ice-out is not safe, fishable or reachable. It is a volunteer's report of when the ice left, under definitions the DNR does not publish. Ice can linger in bays, along shore and at ramps after a lake is called open, and wind can push it back. Nothing here says any ice is safe.
- Only 65 lakes, and not a random sample. They are lakes with long reporting histories, mostly near people. Large northern lakes such as Red Lake, Lake of the Woods and Winnibigoshish are not in the set, and a lake that is not here may behave differently. Rainy Lake is in the set but is a border water with its own rules.
- Gaps. 82% of possible lake-years have a report (1,492 of 1,820). About 57 lakes reported per year in 1999 to 2012 and about 49 in 2013 to 2026, so the two eras do not use quite the same lakes. We do not know why reports are missing.
- Only the years we can support. The opener rule is confirmed in the statute from the 1999 edition on, so the study starts there. We could not confirm the rule for earlier years, so they are not used.
- The rules change and vary by water. Some border waters (with Canada, Wisconsin, the Dakotas and Iowa) and some individual lakes have different seasons, and the DNR can close areas where fish are spawning. Confirm the current opener date and the rules for your water with the DNR before you go.
- Weather is not in the numbers. We did not join spring temperatures. The result says when ice left, not why.
How we did this
- Two sources joined
- Ice-out reports from the Minnesota DNR (the same 65 lakes and download as our ice-out study) and the fishing opener for each year, worked out from the statute.
- The opener rule
- Minnesota Statutes 97C.395 sets the season for walleye, sauger and northern pike, among other species, from the Saturday two weeks before the Saturday of Memorial Day weekend. We read the statute text in the 1999, 2006 and 2025 editions and found the same wording, then checked the computed dates against the DNR's season table (May 9, 2026 to May 11, 2030) and against dates printed on DNR climate pages for 2012 to 2016.
- The window
- 1999 to 2026: 28 openers. The section was last amended in 1995 before the 1999 edition, and we could not retrieve an earlier edition to read, so earlier years are left out.
- Days open
- For each lake and year, the opener date minus the reported ice-out date, in whole days using real calendar dates, so leap years need no special case. Positive means ice-out came before the opener. Zero is the opener day. Negative means ice-out came after it.
- One value per lake-year
- Where several agencies reported the same lake and year we use the middle report (the earlier of two middle values), as in the ice-out study.
- Close calls
- A lake-year is a close call if ice-out was reported less than 7 days before the opener, or later. The cutoff is ours.
- Lakes with little data
- Lakes with fewer than 20 reported years in the window are shown in the CSV and the table, flagged, and are left out of the lookup and shown gray on the map. 12 of the 65 lakes fall below that line.
- Re-running it
- The script reads the saved DNR files and statute pages, and a test recomputes the headline counts separately from the raw files.
We publish counts and summaries computed from the DNR reports, not the individual lake-year reports. The DNR's license allows derived work but not redistributing the data in whole; the license question is not settled by this page. Ice-out background and the long-run trend are in our ice-out study, and any lake's typical date is in the ice-out explorer.
Every lake in the study
| Lake | Latitude | Years of reports | Ice-out after the opener | Less than 7 days before it | Typical days open | Fewest days open |
|---|---|---|---|---|---|---|
| Rainy | 48.61 | 28 | 4 | 5 | 10 | -10 |
| Kabetogama | 48.47 | 27 | 2 | 6 | 11 | -4 |
| Fall | 47.95 | 27 | 0 | 3 | 17 | 1 |
| Burntside | 47.93 | 18 | Too few years | Too few years | ||
| Shagawa | 47.92 | 25 | 1 | 5 | 16 | -1 |
| Vermilion | 47.88 | 28 | 3 | 4 | 13 | -6 |
| Turtle | 47.62 | 22 | 1 | 2 | 18.5 | -1 |
| Jessie | 47.58 | 20 | 1 | 3 | 21.5 | -3 |
| Embarrass | 47.53 | 27 | 1 | 1 | 21 | -1 |
| Bemidji | 47.51 | 28 | 3 | 2 | 16 | -6 |
| Itasca | 47.22 | 28 | 1 | 1 | 21.5 | -2 |
| Leech (Main Basin) | 47.17 | 7 | Too few years | Too few years | ||
| Leech | 47.16 | 28 | 2 | 4 | 18 | -4 |
| Long | 47.02 | 25 | 0 | 2 | 20 | 0 |
| Portage | 46.97 | 26 | 0 | 1 | 25 | 2 |
| Long | 46.82 | 23 | 0 | 1 | 25 | 1 |
| Detroit | 46.79 | 26 | 1 | 0 | 26 | -1 |
| Big Sandy | 46.76 | 27 | 1 | 0 | 23 | -1 |
| Lower Hay | 46.67 | 19 | Too few years | Too few years | ||
| Gull | 46.45 | 25 | 1 | 1 | 23 | -4 |
| Shamineau | 46.25 | 20 | 1 | 0 | 28 | -3 |
| Mille Lacs | 46.24 | 28 | 1 | 3 | 18 | -5 |
| Big Pine | 46.21 | 20 | 0 | 0 | 24.5 | 11 |
| Alexander | 46.21 | 27 | 1 | 1 | 26 | -3 |
| Pierz | 45.96 | 23 | 0 | 1 | 30 | 4 |
| Louise | 45.93 | 27 | 0 | 1 | 28 | 1 |
| Le Homme Dieu | 45.93 | 24 | 1 | 0 | 27 | -2 |
| Ann | 45.92 | 14 | Too few years | Too few years | ||
| Osakis | 45.90 | 28 | 1 | 0 | 27 | -2 |
| Minnewaska | 45.62 | 27 | 0 | 1 | 33 | 0 |
| Watab | 45.60 | 27 | 0 | 0 | 31 | 8 |
| Fish | 45.58 | 21 | 0 | 1 | 36 | 5 |
| Big Stone | 45.41 | 28 | 0 | 1 | 36.5 | 3 |
| Koronis | 45.34 | 24 | 0 | 1 | 33.5 | 4 |
| Bone | 45.29 | 8 | Too few years | Too few years | ||
| Forest | 45.27 | 26 | 0 | 0 | 38 | 9 |
| Cedar | 45.27 | 23 | 0 | 0 | 30 | 8 |
| Green | 45.25 | 28 | 0 | 1 | 31.5 | 3 |
| Diamond | 45.18 | 10 | Too few years | Too few years | ||
| Buffalo | 45.16 | 14 | Too few years | Too few years | ||
| Bald Eagle | 45.11 | 24 | 0 | 0 | 36.5 | 9 |
| White Bear | 45.08 | 28 | 0 | 0 | 36 | 8 |
| Howard | 45.07 | 13 | Too few years | Too few years | ||
| Owasso | 45.03 | 20 | 0 | 0 | 40.5 | 19 |
| Medicine | 45.01 | 28 | 0 | 0 | 39 | 10 |
| Mary | 45.00 | 24 | 0 | 0 | 34 | 9 |
| Lake of the Isles | 44.96 | 24 | 0 | 0 | 39 | 12 |
| Bde Maka Ska | 44.94 | 28 | 0 | 0 | 38 | 11 |
| Minnetonka | 44.93 | 28 | 0 | 0 | 34.5 | 7 |
| Harriet | 44.92 | 27 | 0 | 0 | 38 | 11 |
| Christmas | 44.90 | 20 | 0 | 0 | 36 | 9 |
| Galpin | 44.90 | 15 | Too few years | Too few years | ||
| Silver | 44.90 | 11 | Too few years | Too few years | ||
| Waconia | 44.87 | 28 | 0 | 0 | 36.5 | 8 |
| Upper Prior | 44.71 | 22 | 0 | 0 | 40.5 | 12 |
| Shields | 44.37 | 26 | 0 | 0 | 42.5 | 12 |
| Cedar | 44.29 | 21 | 0 | 0 | 42 | 13 |
| Washington | 44.25 | 23 | 0 | 0 | 41 | 13 |
| Tetonka | 44.23 | 28 | 0 | 0 | 43 | 13 |
| Madison | 44.19 | 28 | 0 | 0 | 42 | 12 |
| Hanska | 44.14 | 8 | Too few years | Too few years | ||
| Shetek | 44.12 | 25 | 0 | 0 | 44 | 25 |
| Clear | 44.09 | 27 | 0 | 0 | 45 | 13 |
| Fountain | 43.66 | 24 | 0 | 0 | 38 | 15 |
| Sisseton | 43.65 | 11 | Too few years | Too few years |
Data collected .
Download the data
- Opener and ice-out by year (CSV)
One row per year: opener date, lakes reporting, and how many had ice-out after, on or within a week before the opener.
- Opener and ice-out by lake (CSV)
One row per lake: years of data, counts of late and close years, days of open water before the opener, and the same counts for 1999 to 2012 and 2013 to 2026.
How we know this
Every source below was opened and read for this draft on the date shown. Rules and prices change, so confirm with the source before you act on anything here. What these labels mean.
Minnesota Statutes 97C.395, subdivision 1, sets the season for walleye, sauger and northern pike, among other species, from the Saturday two weeks prior to the Saturday of Memorial Day weekend. The wording is the same in the 1999, 2006 and 2025 editions we read.
Official source checkedSource: revisor.mn.gov · Checked by AI research draft, human review pending
Limits: Editions before 1999 could not be retrieved, so the rule is not confirmed for earlier years. The commissioner can close areas where fish are spawning. Statutes change.
The DNR fishing-seasons table lists the fishing opener for Minnesota waters as May 9, 2026, May 15, 2027, May 13, 2028, May 12, 2029 and May 11, 2030. These match the statute rule.
Published by the providerSource: dnr.state.mn.us · Checked by AI research draft, human review pending
Limits: The page also has separate sections for border waters with Canada, Iowa, North Dakota, South Dakota and Wisconsin, which we did not review. Confirm the current dates with the DNR.
DNR climate pages state opener dates of May 12, 2012, May 10, 2014, May 9, 2015 and May 14, 2016, matching the rule, and describe ice still on northern lakes and Mille Lacs at the 2013 opener.
Published by the providerSource: dnr.state.mn.us · Checked by AI research draft, human review pending
Limits: One of these pages gives May 11 for 2014 in one place and May 10 in another. We took the rule's date, May 10, which matches the other mention.
Ice-out dates are reports from volunteer observers collected by the Minnesota DNR, which computes its own medians from 1950 on.
Official source checkedSource: dnr.state.mn.us · Checked by AI research draft, human review pending
Limits: The DNR does not publish how each observer defined ice-out. An ice-out date does not mean a ramp is clear or ice is safe.
The DNR lets people make derivative works from its climatology data but does not allow the data in its entirety to be resold, distributed or displayed commercially. This page publishes counts and summaries, not the individual reports.
Official source checkedSource: dnr.state.mn.us · Checked by AI research draft, human review pending
Limits: A plain reading of the license text. Confirm with the DNR before treating the CSV files as cleared.
Something wrong or out of date? Email rice.john.nextgenai@gmail.com with the page and a source.